Prometheus Scraping Configurations by Example
Exploring Prometheus scraping configurations using Kubernetes pods.

Prerequisites
If you wish to follow along, you will need access to a Kubernetes cluster (v1.19+). You will also need Helm (v3.7+) installed on your workstation.
Install Example Application
Here we will use an example application provided by Google as the source of the metrics.
We install it using the following command.
$ kubectl -n default apply -f https://raw.githubusercontent.com/GoogleCloudPlatform/prometheus-engine/v0.13.0/examples/example-app.yamlHere we can see the three running pods.

We can confirm that metrics are available on the pods on port 1234 and endpoint /metrics by using port forwarding.
$ kubectl port-forward pod/prom-example-7dfd68fd5-nhnrd 8080:1234 -n default
Forwarding from 127.0.0.1:8080 -> 1234
Forwarding from [::1]:8080 -> 1234
and then using a browser we can indeed see the metrics.

Install Prometheus
While it is possible to construct our own Kubernetes manifests around the prom/prometheus Docker container image, doing so would have felt like re-inventing the wheel.
Bumped into the Prometheus Operator.
Prometheus Operator is a Kubernetes Operator that provides Kubernetes native deployment and management of Prometheus and related monitoring components.
Looking at this, it seemed to require a big investment into learning new abstractions on top of Prometheus; not what I am looking for at this point in time.
Ended up finding what appears to be a relatively authoritative Helm chart, Prometheus, that seemed like a better fit; it provides all the Kubernetes manifests but you still directly configure the Prometheus server.
Following the instructions provided, we start by adding the Helm repository.
$ helm repo add prometheus-community https://prometheus-community.github.io/helm-charts
$ helm repo update
We indeed can search the repository and see the Helm chart and version (using the -l option, one can see all the versions).
$ helm search repo prometheus-community
...
prometheus-community/prometheus                    26.0.1        v3.0.1      Prometheus is a monitoring system and time seri...
...
Rather that install the Helm chart with all the defaults, we can see all the configuration options with the following command.
$ helm show values prometheus-community/prometheusWow… There is a lot there. Scanning the options there are two changes we want to make:
- The default scraping configurations are very complex; we start by simplifying it to just scrape the Prometheus service itself
- We disable all the subcharts as we are only focused on Prometheus
We do this by creating a file values.yaml with the following.
serverFiles:
  prometheus.yml:
    scrape_configs:
      - job_name: prometheus
        static_configs:
          - targets:
            - localhost:9090
alertmanager:
  enabled: false
kube-state-metrics:
  enabled: false
prometheus-node-exporter:
  enabled: false
prometheus-pushgateway:
  enabled: false
We then install Prometheus with the following command:
helm install myprom prometheus-community/prometheus \
  --version=26.0.1 \
  --create-namespace \
  --namespace=monitoring \
  --values=values.yaml
The install output conveniently gives a command we can use to use our workstation’s browser to connect to the Prometheus UI.
$ export POD_NAME=$(kubectl get pods --namespace monitoring -l "app.kubernetes.io/name=prometheus,app.kubernetes.io/instance=myprom" -o jsonpath="{.items[0].metadata.name}")
$ kubectl --namespace monitoring port-forward $POD_NAME 9090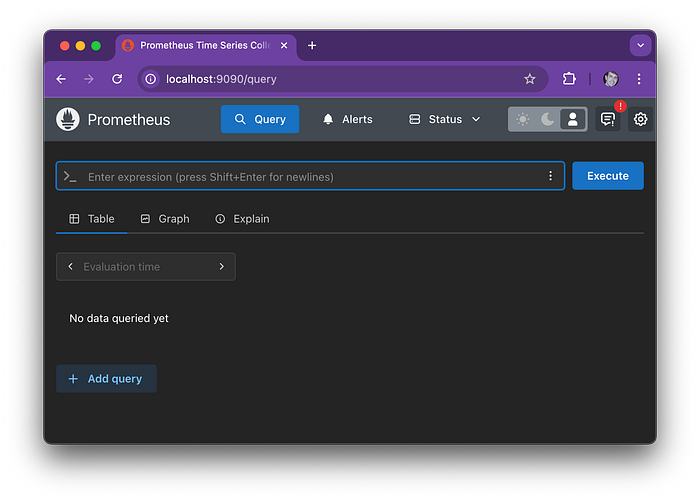
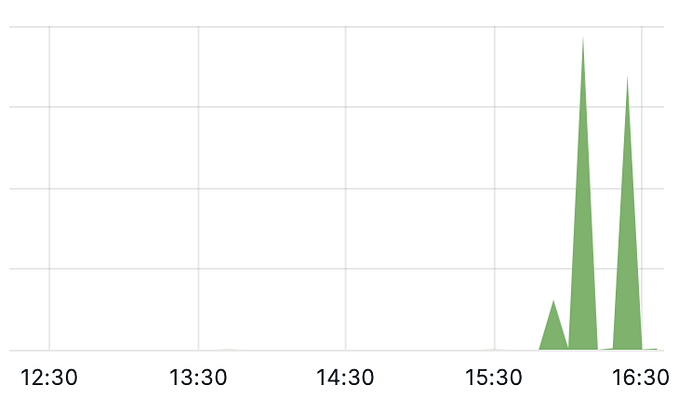
We confirm that metrics are being scraped by executing the query up with the response below.

Scrape Example Application
Here we move onto scraping the three pods running in the default namespace. Examining the prom-example deployment (and thus the pods), we see that each pod only has a single container with a single specified port (1234).
$ kubectl get deployment prom-example -n default -o yaml
...
        ports:
        - containerPort: 1234
          name: metrics
          protocol: TCP
...
Also, in our test cluster we (at least on mine) only have the three pods from the prom-example deployment in the default namespace.
The solution amounts to adding a second job in the values.yaml file we created earlier.
- job_name: 'default-namespace-pods'
        kubernetes_sd_configs:
          - role: pod
        relabel_configs:
          - source_labels: [__meta_kubernetes_namespace]
            action: keep
            regex: default
Digging into this, we are using the Kubernetes SD configuration:
Kubernetes SD configurations allow retrieving scrape targets from Kubernetes’ REST API and always staying synchronized with the cluster state.
with the pod role.
The pod role discovers all pods and exposes their containers as targets. For each declared port of a container, a single target is generated. If a container has no specified ports, a port-free target per container is created for manually adding a port via relabeling.
And then we use a relabeling configuration:
Relabeling is a powerful tool to dynamically rewrite the label set of a target before it gets scraped. Multiple relabeling steps can be configured per scrape configuration. They are applied to the label set of each target in order of their appearance in the configuration file.
and a label added by the Kubernetes SD configuration.
__meta_kubernetes_namespace: The namespace of the pod object.
The meaning of source labels here is:
# The source labels select values from existing labels. Their content is concatenated
# using the configured separator and matched against the configured regular expression
# for the replace, keep, and drop actions.
[ source_labels: ‘[‘ <labelname> [, …] ‘]’ ]
and the keep action.
keep: Drop targets for which regex does not match the concatenated source_labels.
With this change, we can upgrade the Helm release.
helm upgrade myprom prometheus-community/prometheus \
--version=26.0.1 \
--namespace=monitoring \
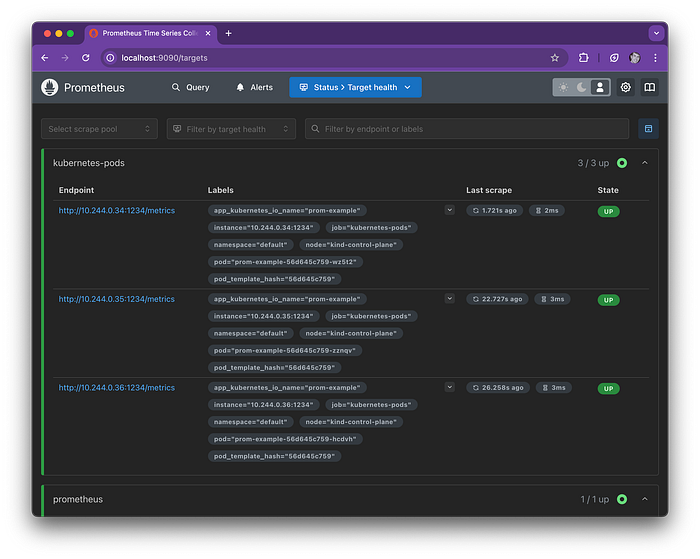
--values=values.yamlAs before we use our browser to connect to Prometheus UI and navigating using the Status > Target health menus we can indeed see the new three expected targets.
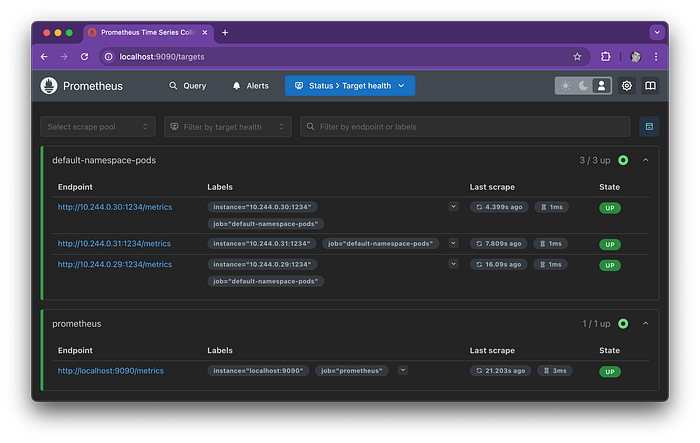
One important thing to notice is that many of the labels, e.g., __meta_kubernetes_namespace, did not make it into the stored labels for the endpoint (and thus the time series). This is because label name starting with the double underscore are not stored; some subtle magic here.
Improving on Scraping Example Application
The previous solution required that we know a lot about the pods that we scraping, e.g. among other things, we needed to know that the pods only had a single container with a single specified port that had metrics on the /metrics metrics path.
The improved solution is to annotate the pods that we wish to scrape with sufficient information to have Prometheus properly scape them. The good news is that we can go back into the Helm chart default value for the scrape_configs and find an example job that does exactly this.
Here is the comment that describes the behavior of the kubernetes-pods job.
$ helm show values prometheus-community/prometheus
...
      # Example scrape config for pods
      #
      # The relabeling allows the actual pod scrape endpoint to be configured via the
      # following annotations:
      #
      # * `prometheus.io/scrape`: Only scrape pods that have a value of `true`,
      # except if `prometheus.io/scrape-slow` is set to `true` as well.
      # * `prometheus.io/scheme`: If the metrics endpoint is secured then you will need
      # to set this to `https` & most likely set the `tls_config` of the scrape config.
      # * `prometheus.io/path`: If the metrics path is not `/metrics` override this.
      # * `prometheus.io/port`: Scrape the pod on the indicated port instead of the default of `9102`.
In preparation of using the improved solution, we need to go back and add the following annotations to the deployment’s pod template.
prometheus.io/scrape: "true"
prometheus.io/port: "1234"
The easiest way of doing this is simply by editing the deployment:
$ kubectl edit deployment prom-example -n defaultnote: Once the deployment’s pod template is changed, the pods are replaced (with the annotations).
Finally, we replace the job, default-namespace-pods, we created in the last section with the kubernetes-job example provided in the Helm chart default values (see below). We do this as before by editing the values.yaml and using helm upgrade.
Yes, this is appears mind-boggling complex at first glance; we will dig into this configuration below.
      - job_name: 'kubernetes-pods'
        honor_labels: true

        kubernetes_sd_configs:
          - role: pod

        relabel_configs:
          - source_labels: [__meta_kubernetes_pod_annotation_prometheus_io_scrape]
            action: keep
            regex: true
          - source_labels: [__meta_kubernetes_pod_annotation_prometheus_io_scrape_slow]
            action: drop
            regex: true
          - source_labels: [__meta_kubernetes_pod_annotation_prometheus_io_scheme]
            action: replace
            regex: (https?)
            target_label: __scheme__
          - source_labels: [__meta_kubernetes_pod_annotation_prometheus_io_path]
            action: replace
            target_label: __metrics_path__
            regex: (.+)
          - source_labels: [__meta_kubernetes_pod_annotation_prometheus_io_port, __meta_kubernetes_pod_ip]
            action: replace
            regex: (\d+);(([A-Fa-f0-9]{1,4}::?){1,7}[A-Fa-f0-9]{1,4})
            replacement: '[$2]:$1'
            target_label: __address__
          - source_labels: [__meta_kubernetes_pod_annotation_prometheus_io_port, __meta_kubernetes_pod_ip]
            action: replace
            regex: (\d+);((([0-9]+?)(\.|$)){4})
            replacement: $2:$1
            target_label: __address__
          - action: labelmap
            regex: __meta_kubernetes_pod_annotation_prometheus_io_param_(.+)
            replacement: __param_$1
          - action: labelmap
            regex: __meta_kubernetes_pod_label_(.+)
          - source_labels: [__meta_kubernetes_namespace]
            action: replace
            target_label: namespace
          - source_labels: [__meta_kubernetes_pod_name]
            action: replace
            target_label: pod
          - source_labels: [__meta_kubernetes_pod_phase]
            regex: Pending|Succeeded|Failed|Completed
            action: drop
          - source_labels: [__meta_kubernetes_pod_node_name]
            action: replace
            target_label: node
As before we use our browser to connect to Prometheus UI and navigating using the Status > Target health menus we can indeed see the three expected targets and they now more labels.
Let us dig into this confirmation a bit. From the Prometheus Configuration documentation we read about what honor_labels does.
# honor_labels controls how Prometheus handles conflicts between labels that are
# already present in scraped data and labels that Prometheus would attach
# server-side (“job” and “instance” labels, manually configured target
# labels, and labels generated by service discovery implementations).
#
# If honor_labels is set to “true”, label conflicts are resolved by keeping label
# values from the scraped data and ignoring the conflicting server-side labels.
In this example, I do not believe any of the labels in the scraped metrics collide with the ones added by Prometheus.
The first relabel configuration has the keep action that we saw previously; only keeping those pods that have the prometheus.io/scrape annotation set to true.
- source_labels: [__meta_kubernetes_pod_annotation_prometheus_io_scrape]
  action: keep
  regex: true
Here we are using the fact that the Kubernetes SD configuration adds labels based on the Pod annotations; the documentation misses that unsupported characters are converted to an underscore.
__meta_kubernetes_pod_annotation_<annotationname>: Each annotation from the pod object.
The second relabel configuration with the drop action is fairly explanatory; will leave it to the reader to interpret.
The next four relabel configurations use the replace action; here we will focus one of the more complex ones that is relevant to our example workload.
In particular, this configuration is what allows Prometheus to know to scrape port 1234 based on the pod annotation: prometheus.io/port: “1234”.
- source_labels: [__meta_kubernetes_pod_annotation_prometheus_io_port, __meta_kubernetes_pod_ip]
  action: replace
  regex: (\d+);((([0-9]+?)(\.|$)){4})
  replacement: $2:$1
  target_label: __address__
As with similar labels we observed earlier, the two labels listed in the source labels are from the Kubernetes SD configuration.
There is the replace action.
replace: Match regex against the concatenated source_labels. Then, set target_label to replacement, with match group references (${1}, ${2}, …) in replacement substituted by their value. If regex does not match, no replacement takes place.
Squinting at the regular expression, it is designed to match strings like [PORT];[IPV4_ADDRESS], e.g., in our example 1234;10.244.0.34, and saving the port in variable $1 and IPv4 address in variable $2.
There are some special labels added by Promethus; one, __address__, that is being targeted in this example.
Initially, aside from the configured per-target labels, a target’s job label is set to the job_name value of the respective scrape configuration. The __address__ label is set to the <host>:<port> address of the target. After relabeling, the instance label is set to the value of __address__ by default if it was not set during relabeling.
The __scheme__ and __metrics_path__ labels are set to the scheme and metrics path of the target respectively, as specified in scrape_config.
Here is important to know that by changing the __address__, __scheme__, and __metrics_path__ labels, we actually are directing Prometheus to scrape the proper endpoint.
The next two relabel configurations use the action labelmap; let us focus on the second one as it applies to our example workload.
- action: labelmap
  regex: __meta_kubernetes_pod_label_(.+)
Let us explore what the labelmap action does.
labelmap: Match regex against all source label names, not just those specified in source_labels. Then copy the values of the matching labels to label names given by replacement with match group references (${1}, ${2}, …) in replacement substituted by their value.
In our example, pods have two labels:
    labels:
      app.kubernetes.io/name: prom-example
      pod-template-hash: 56d645c759
Looking at the what the Kubernetes SD configuration does:
__meta_kubernetes_pod_label_<labelname>: Each label from the pod object, with any unsupported characters converted to an underscore.
This means that we have the labels:
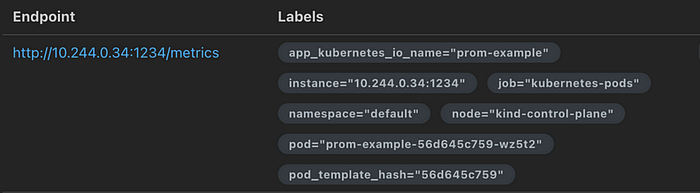
- __meta_kubernetes_pod_label_app_kubernetes_io_name
- __meta_kubernetes_pod_label_pod_template_hash
The regular expression essentially only keeps what is after the __meta_kubernetes_pod_label_ and we can see these labels, app_kuberenetes_io_name and pod_template_hash , in the Prometheus UI.
The remaining relabel configuration use the familiar replace and drop actions; will leave it to the reader to interpret.
Whew… That was a lot.