Deep Dive into Kubernetes CPU Usage, Requests, and Limits

I have had one too many unsatisfactory conversations about setting container CPU requests and limits; thus this article.
CPU, Thread, and Time-Slicing
First let us level set on some concepts.
A central processing unit (CPU), also called a central processor, main processor, or just processor, is the most important processor in a given computer. Its electronic circuitry executes instructions of a computer program,
— Central processing unit — Wikipedia
In computing, a process is the instance of a computer program that is being executed by one or many threads.
— Process (computing) — Wikipedia
In computer science, a thread of execution is the smallest sequence of programmed instructions that can be managed independently by a scheduler,
— Thread (computing) — Wikipedia
The period of time for which a process is allowed to run in a preemptive multitasking system is generally called the time slice or quantum. The scheduler is run once every time slice to choose the next process to run.
— Preemption (computing) — Wikipedia
And then an explanation using a diagram representing a computer with a single CPU and two equal priority processes. One process has three threads, two with pending instructions and the third is blocked, and the other process has a single thread with pending instructions.
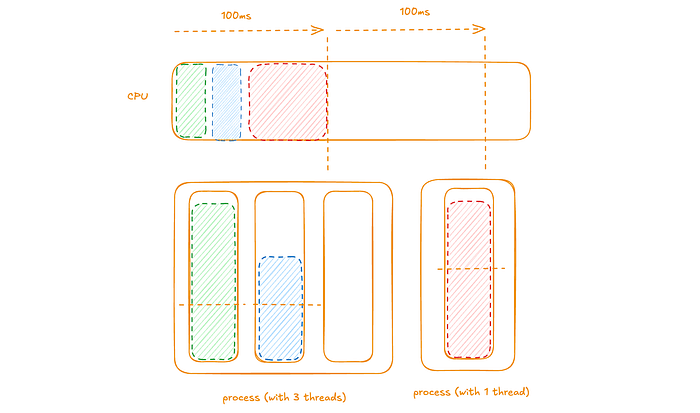
note: This and the following diagrams only represent what is happening in a single representative 100ms time-slice (the left one).
Threads with pending instructions are scheduled to the CPU to run for an appropriate portion of time in the time-slice (here 100ms). Here with both processes being equal priority they evenly split the time-slice; the threads with pending instructions in the first process then evenly share the process’ time-slice. This time-slice cycle repeats.
note: The Linux operating system typically uses 100ms time-slices; observable in the file /proc/sys/kernel/sched_rr_timeslice_ms.
A couple of important points:
- A computer with multiple CPUs operates in much the same way; threads are scheduled to run for an appropriate portion of time in the time-slice on one of the CPUs. In a given time-slice a given thread can only run on a single CPU
- In this example, after the end of the time-slice, all three non-blocked threads still are left with pending instructions to be scheduled in the next time-slice
Baseline
Throughout this article we use a test workload (written in Go) that provides a HTTP endpoint on port 8080 which generates CPU load for 50ms before returning; happens to be a Kubernetes pod (container) running on a Google Kubernetes Engine (GKE) cluster.
We also use the wrk apt package running on a separate load workload to generate HTTP traffic on the test workload.
In this first example we establish a baseline example by:
- Providing 2 CPU to the test workload
- Configure the test workload to use 2 threads
- Configure the load workload to generate a manageable amount of HTTP traffic (1 thread with 1 connection for 5 minutes; or 20 requests per second)
Here we can see a rolling one-minute average of CPU usage (blue line) which is well below the 2 CPU available (red line).

We can also see that from the load workload that the average latency was 50.70ms with a maximum of 55.99ms (pretty much aligned with the 50ms that the endpoints waits to return).
We can consider a diagram representing this example with a computer with 2 CPUs, a single process with 2 threads (each with pending instructions).
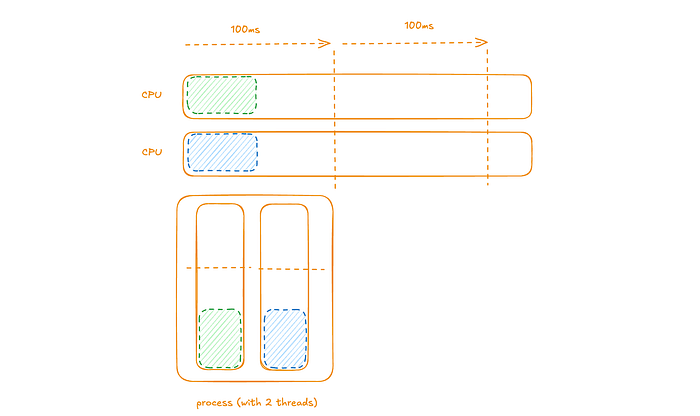
The 2 threads’ pending instructions are scheduled to run on one of the CPUs (again in a given time-slice a given thread can only run on a single CPU). At the end of the time-slice both threads have no pending instructions to be scheduled in the next time-slice.
note: These diagrams does not reflect when in the 100ms time-slice the instructions are executed.
Too Few Threads
Here will illustrate an example where our workload has too few threads as compared to the amount of CPU we have available; specifically:
- Providing 2 CPU to the test workload
- Configure the test workload to use 1 threads (this is the only difference from the previous example)
- Configure the load workload to generate a manageable amount of HTTP traffic (1 thread with 1 connection for 5 minutes; or 20 requests per second)
Here we can see a rolling one-minute average of CPU usage (blue line) which is well below the 2 CPU available (red line).

We can also see that from the load workload that the average latency was 62.44ms with a maximum of 99.30ms (here we see a significant degradation in performance as compared to the baseline example).
We can consider a diagram representing this example with a computer with 2 CPUs, a single process with 1 thread with pending instructions.
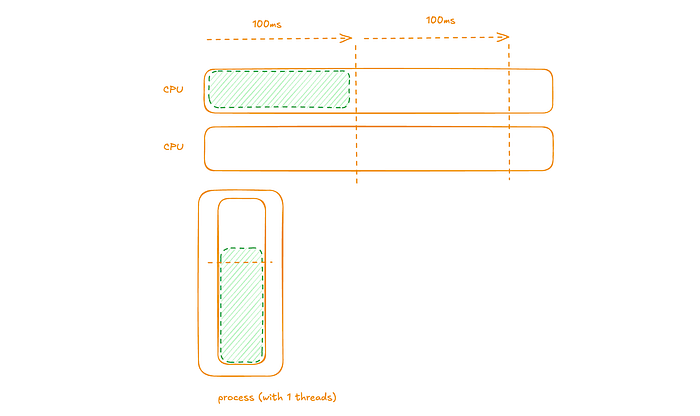
The single thread’s pending instructions are scheduled to run on one of the CPUs (here the fact that in a given time-slice a given thread can only run on a single CPU is critical). At the end of the time-slice the thread has pending instructions to be scheduled in the next time-slice.
The general idea here is that it is important to have at least as many threads as the CPU provided to the workload. Having more threads does not have as a dramatic negative impact on performance; but there are examples (e.g., some workloads written in Go) where doing so does have an impact.
Kubernetes CPU Requests and Limits
Next some more concepts.
When you specify the resource request for containers in a Pod, the kube-scheduler uses this information to decide which node to place the Pod on. When you specify a resource limit for a container, the kubelet enforces those limits so that the running container is not allowed to use more of that resource than the limit you set. The kubelet also reserves at least the request amount of that system resource specifically for that container to use.
and
If the node where a Pod is running has enough of a resource available, it’s possible (and allowed) for a container to use more resource than its request for that resource specifies.
and
cpu limits are enforced by CPU throttling. When a container approaches its cpu limit, the kernel will restrict access to the CPU corresponding to the container’s limit. Thus, a cpu limit is a hard limit the kernel enforces. Containers may not use more CPU than is specified in their cpu limit.
— Resource Management for Pods and Containers
note: In the previous examples, the container was specified with a CPU request = limit of 2 CPU.
Also, while it may be obvious, not setting a CPU limit is roughly equivalent to setting an infinitely high CPU limit.
High CPU Usage (High CPU Limits to the Rescue)
Here will illustrate an example where our workload has too much load but a high CPU limit prevents the workload from having performance issues; specifically:
- Providing 2 CPU (Request) to the test workload
- Providing 4 CPU (Limit) to the test workload
- Configure the test workload to use 4 threads (so it can use all 4 CPUs)
- Configure the load workload to generate a high amount of HTTP traffic (1 thread with 3 connections for 5 minutes; or 60 requests per second)
Here we can see a rolling one-minute average of CPU usage (blue line) which is above the 2 CPU request (green line) but well below the 4 CPU limit (red line).

We can also see that from the load workload that the average latency was 51.21ms with a maximum of 68.88ms (again, pretty much aligned with the 50ms that the endpoints waits to return).
We can consider a diagram representing this example with a computer with 4 CPUs, a single process with 4 threads (each with pending instructions).
note: Here we are illustrating a situation where the computer (actually Kubernetes node) has no other processes using significant CPU.
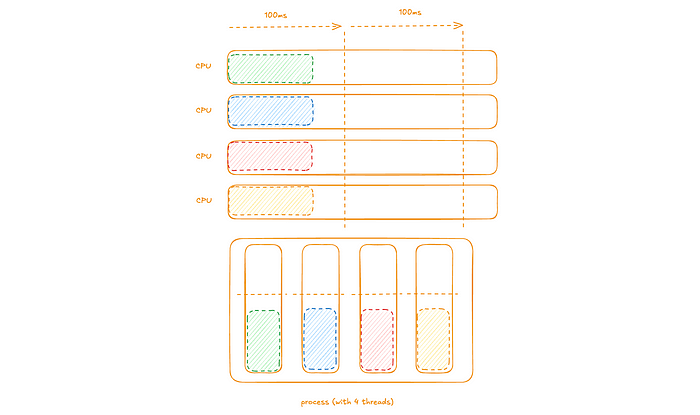
The 4 threads’ pending instructions are scheduled to run on one of the CPUs (again in a given time-slice a given thread can only run on a single CPU). At the end of the time-slice all the threads have no pending instructions to be scheduled in the next time-slice.
High CPU Usage (High CPU Limits Little Help)
Here will illustrate an example where our workload has too much load but a high CPU limit does not prevent the workload from having performance issues; specifically:
- Providing 2 CPU (Request) to the test workload
- Providing 4 CPU (Limit) to the test workload
- Configure the test workload to use 4 threads (so it can use all 4 CPUs)
- Configure the load workload to generate a high amount of HTTP traffic (1 thread with 3 connections for 5 minutes; or 60 requests per second)
and forcing a second workload using up CPU to the same computer (Kubernetes node):
- Providing 1660m CPU (Request) to an other workload; here we are packing a 4 CPU node
- Providing 1660m (Limit) to an other workload
- Configure the other workload to use 2 threads (so it can use 2 CPUs)
- Configure another load workload to generate a high amount of HTTP traffic (1 thread with 2 connections for 30 minutes; or 40 requests per second)
Here we can see a rolling one-minute average of CPU usage (blue line) which is just above the 2 CPU request (green line) but well below the 4 CPU limit (red line).

At the same time the other workload has a consistent CPU usage around 1.6 CPU (equal to its CPU request and limit).

We can also see that from the load workload that the average latency was 66.11ms with a maximum of 94.39ms (here significantly higher than the ideal 50ms).
We can consider a diagram representing this example with a computer with 4 CPUs. Two processes; the first with 4 threads (each with pending instructions) and the second with 2 threads (each with pending instructions).
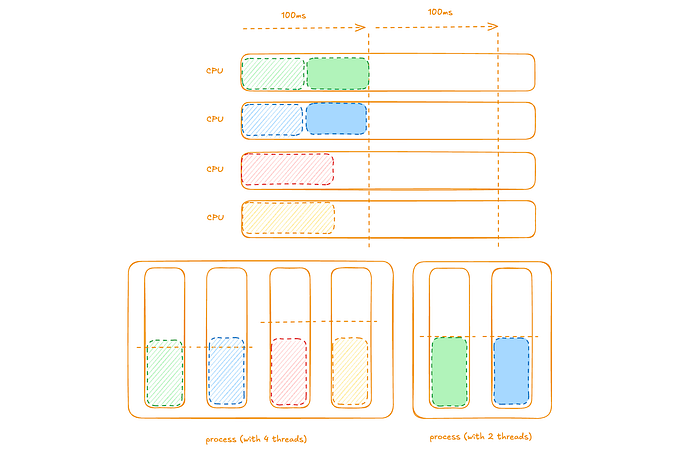
The workload’s 4 threads’ pending instructions are scheduled to run on one of the CPUs (again in a given time-slice a given thread can only run on a single CPU). At the end of the time-slice two of the four threads have no pending instructions to be scheduled in the next time-slice; the other two do.
The key takeaway from the last two examples is that setting a high CPU limit is most useful when the computer (or Kubernetes node) does not have any other processes using significant CPU; less useful when it does.
Intermittent CPU Usage (Low CPU Limits to the Rescue)
Here we explore a scenario where setting a low CPU limit (essentially equal to the request) solves a problem; specifically:
- Providing 2 CPU (Request) to the test workload
- Providing 2 CPU (Limit) to the test workload
- Configure the test workload to use 2 threads
- Configure the load workload to intermittently generate a high amount of HTTP traffic (1 thread with 4 connections; or 80 requests per second). The pattern is to generate HTTP traffic for 10 seconds followed by no traffic for 50 seconds; repeating over 5 minutes
Here we can see a rolling one-minute average of CPU usage (blue line) which is well below the 2 CPU request / limit (green / red line).

We can also see that from the load workload that the average latency was 82.40ms with a maximum of 122.02ms (here dramatically higher than the ideal 50ms).
We can consider a diagram representing this example with a computer with 4 CPUs, a single process with 2 threads (each with pending instructions). Here during the 10 seconds of traffic.
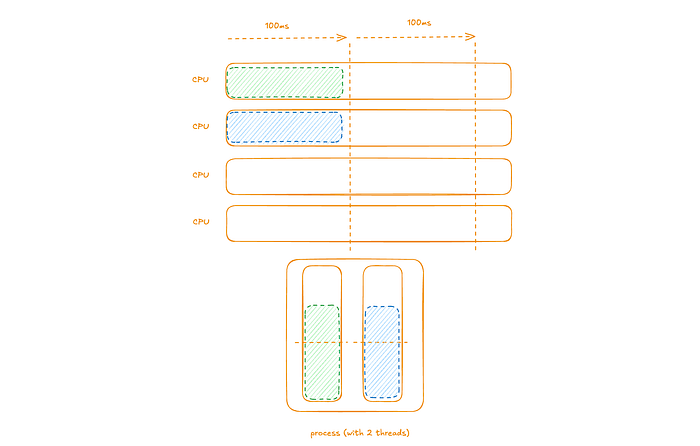
The 2 threads’ pending instructions are scheduled to run on one of the CPUs (again in a given time-slice a given thread can only run on a single CPU). At the end of the time-slice both threads have pending instructions to be scheduled in the next time-slice.
However, during the following 50 seconds there is no traffic.

The seemingly contradiction is that the CPU usage would suggest that there no problem but the latencies definitely showed a problem. The key to understanding this is the the CPU usage metric represents a rolling one-minute average of CPU usage. This means the one-minute average consists of 10 seconds of high CPU usage and 50 seconds of none (thus the low value).
Because we set the limit low (equal to request), when the workload ran out of CPU request it also hit the CPU limit and from the definitions above:
cpu limits are enforced by CPU throttling.
Turns out that there are two relevant container metrics:
metrics container_cpu_cfs_periods_total: Number of elapsed enforcement period intervals
container_cpu_cfs_throttled_total: Number of throttled period intervals
— Monitoring cAdvisor with Prometheus
It turns out that the ratio of the rates (per minute) of these metrics gives us the percentage of time slices that threads of a container (process) had pending instructions to be scheduled in the next time-slice.
Looking at this ratio for this workload, we can see that at one point up to half of the time slices had threads that had pending instructions to be scheduled in the next time-slice.

It is important to point out that the problem that is solved here is not preventing the latency, but rather we have a clear signal of the reason for the latency with the remediation to increase the workload’s CPU request.
Conclusion
From this fairly long article, we can draw some conclusions:
- It is important to have at least as many threads as the CPU requests in a workload
- It is a good practice to set a container’s limits equal to it requests
For the latter conclusion, will lean on other similar article that draws the same conclusion.
If containers are underprovisioned in terms of CPU requests and have specified CPU requests that are much lower than their limits (or they have not specified any limits at all), application performance will vary depending on the level of CPU contention on the node at any given time. If an application regularly needs more CPU than it requested, it may perform well as long as it can access the CPU it needs. However, its performance will start to suffer if a set of new pods that have higher CPU needs get scheduled on the same node, and the node’s available capacity decreases.
Setting CPU limits on your application’s containers to be close or equal to requests will warn you earlier about new CPU demands, instead of only discovering this after there is contention on the node.
— Kubernetes CPU limits and requests: A deep dive
The end.